matBRAT
matBRAT - Beaver Restoration Assessment Tool (Matlab based - version 1 to 2.03)

8. Running BRAT Model
The dam-building beaver capacity model consists of two FIS models, a vegetation_FIS and a combined_FIS. The vegetation_FIS is a two input FIS that uses the 30 m (stream bank vegetation) and 100 m (riparian and adjacent upland vegetation) buffer data to calculate a dam-building capacity based on land cover classification values (i.e., beaver preferences 0-4 values) (Figure 3). Note: if you are new to fuzzy logic and the MATLAB Fuzzy Logic Toolbox a good place to start would be to read: http://www.mathworks.com/help/pdf_doc/fuzzy/fuzzy.pdf.
.png)
Figure 3. Vegetation FIS, two inputs, based on the 30 m and 100 m LANDFIRE land cover beaver dam capacity classification data.
The combined_FIS, which is a three input FIS that uses the output from the VEG_FIS and the stream power calculations: base flow and two-year peak flow (Figure 4 and 5).
Stream power is an expression of flow strength and the erosive capacity of streams (Worthy, 2005). Total stream power was calculated at base flow to gauge the maximum stream power at which beaver can build dams and at the 2-year recurrence interval to gauge the likelihood of dams persisting from year-to-year due to stream power. Stream power is calculated as:
Ω = ρgQS
Where Ω is the stream power (in Watts), ρ is the density of water (1000 kg/m3), g is acceleration due to gravity (9.8 m/s2), Q is discharge (m3/s), and S is the channel slope.
Calculating stream power on a drainage network requires an estimate of Q at every stream segment and an estimate of slope. To estimate Q, there are many methods for developing regional curve relations that estimate Q from measures that can be readily extracted from a DEM for BRAT we use upslope drainage area and elevation information that you have captured in previous steps in this manual.

Figure 4. Combined dam-building beaver capacity FIS based on output from the vegetation FIS and stream power calculations baseflow and peak 2-year interval.
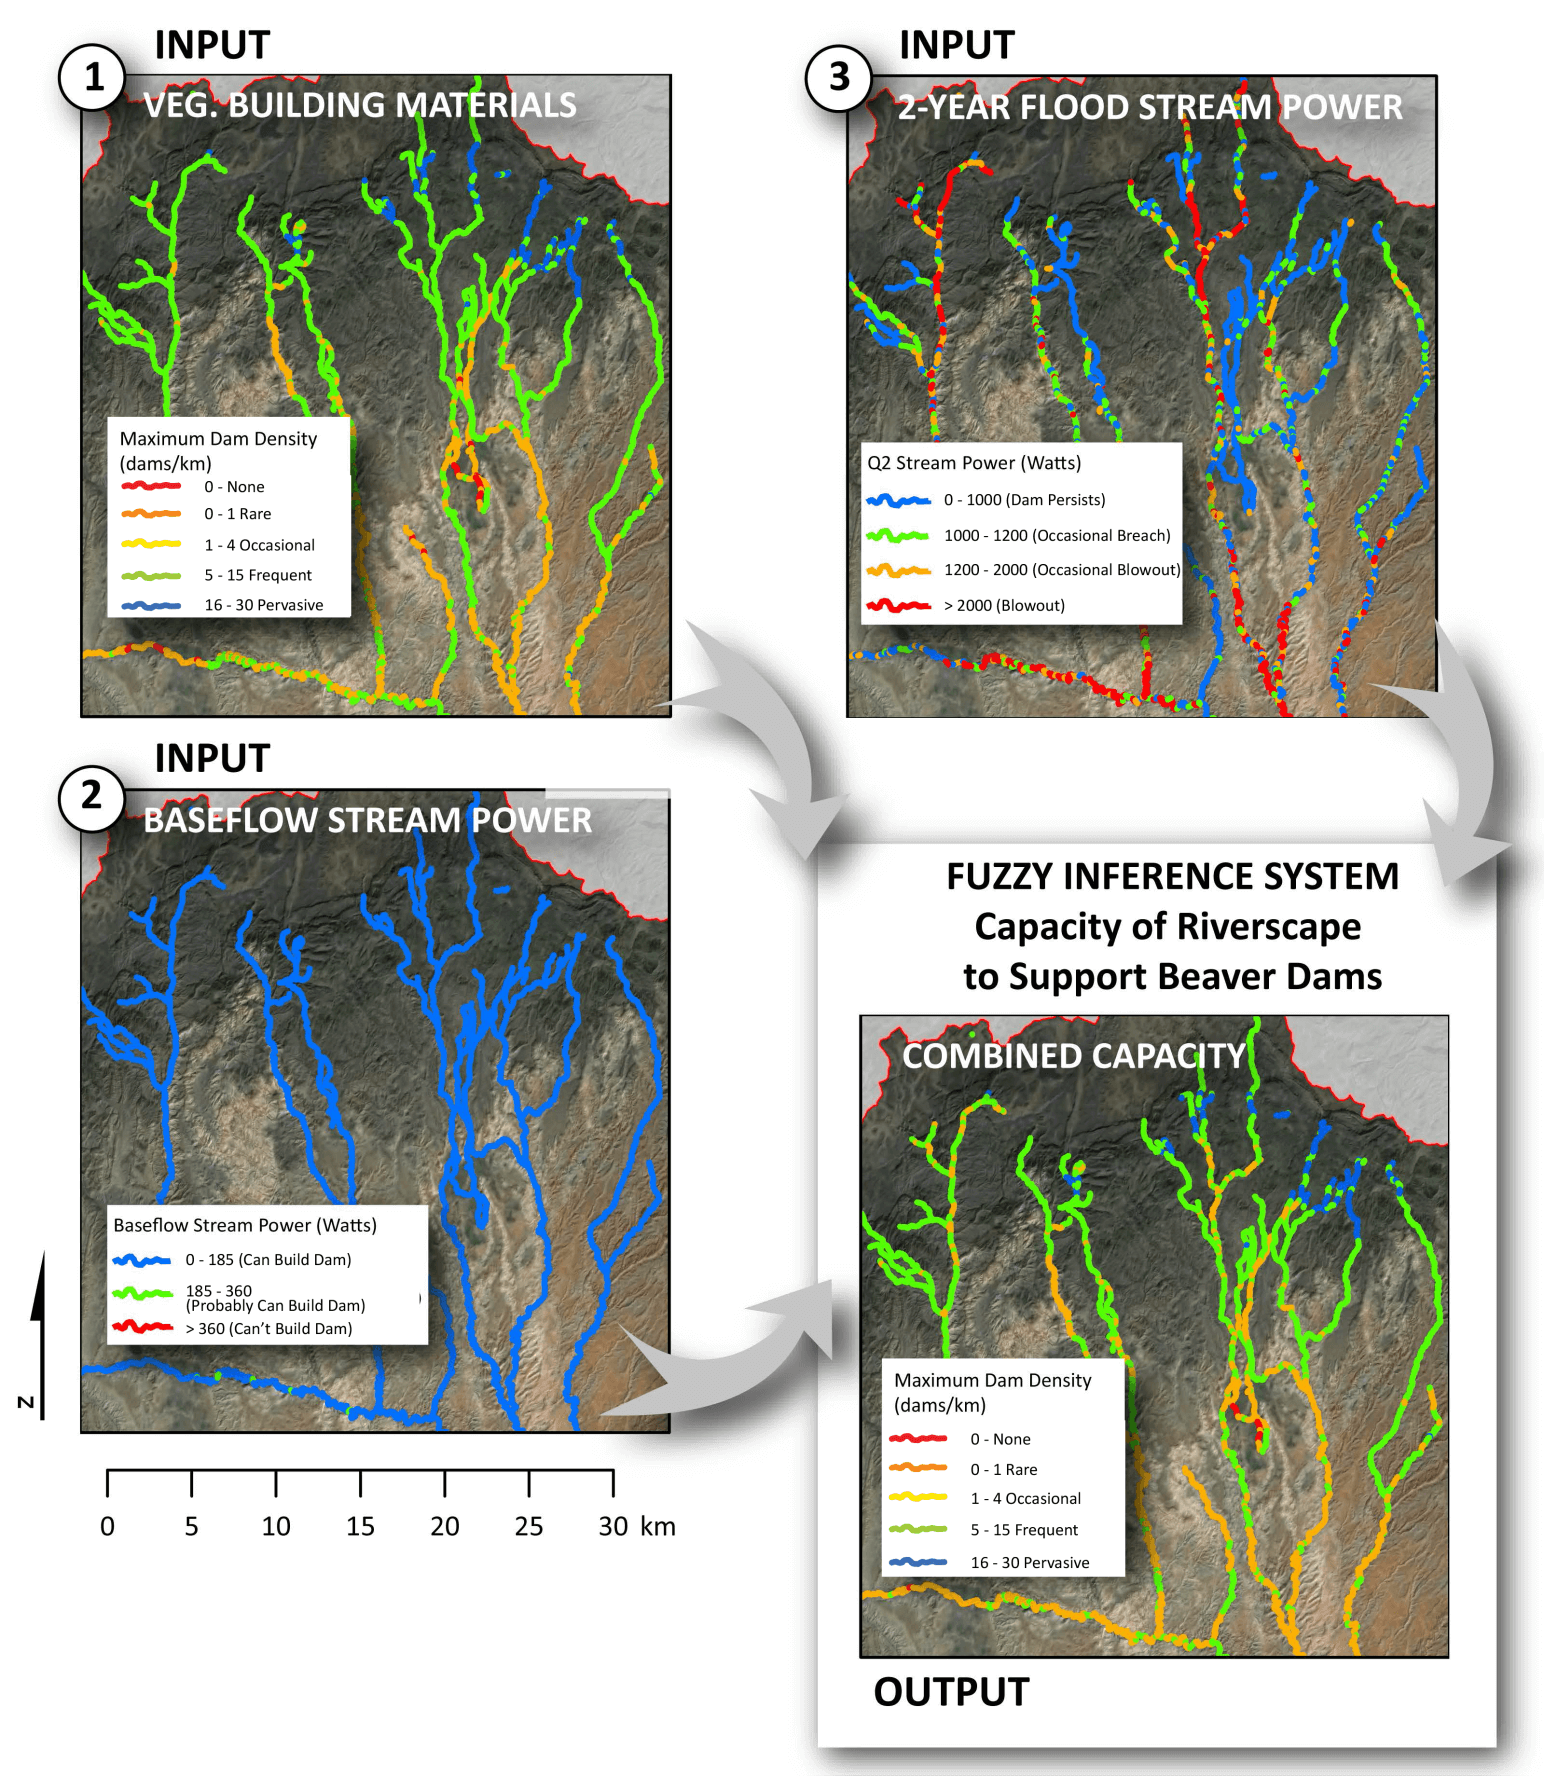
Figure 5 .Methodological illustration of inputs (1-3) and output for the combined model of riverscape capacity to support beaver dam-building activity. Model output is expressed as dam density (dams/km).
Task 1: Run BRAT
-
Step 1: Click on the MATLAB R2012b icon to start the program.
-
Step 2: Browse to the location where the BRAT.m, and associated .m and .fis files are stored:
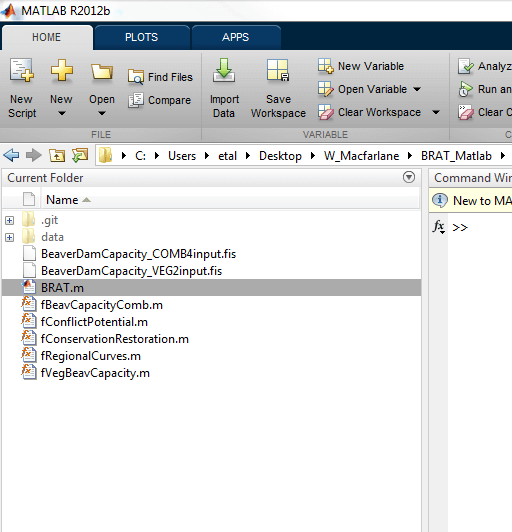
- Step 3: “Double click” on BRAT.m and the Editor Window should open with BRAT.m.
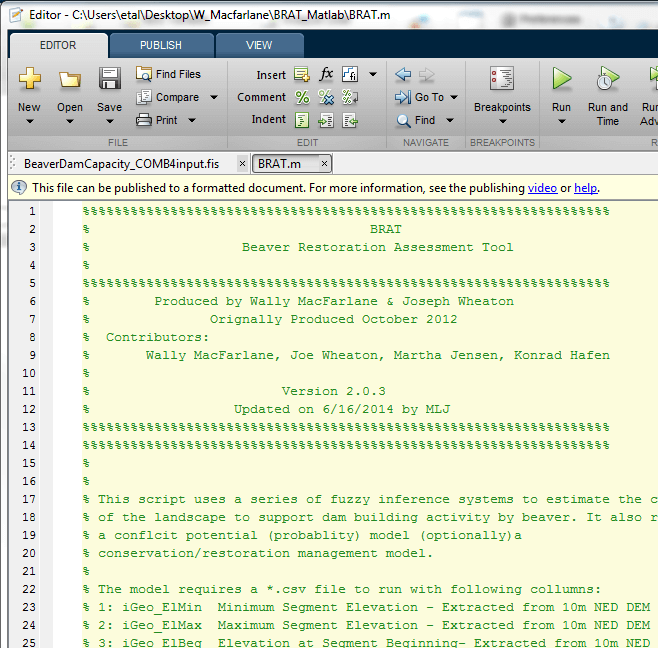
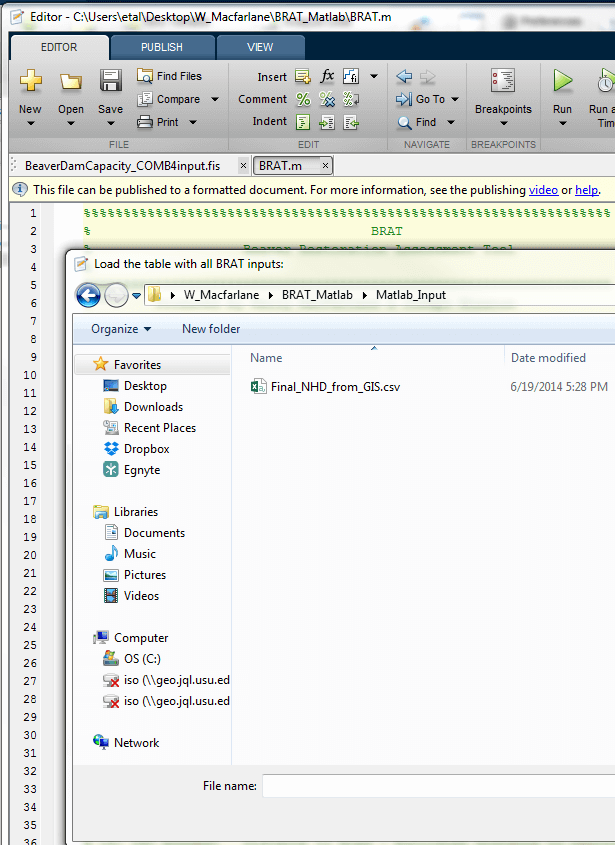
- Step 4: Click on the “Run” icon and the “Load the table with all BRAT inputs” dialog box should open.
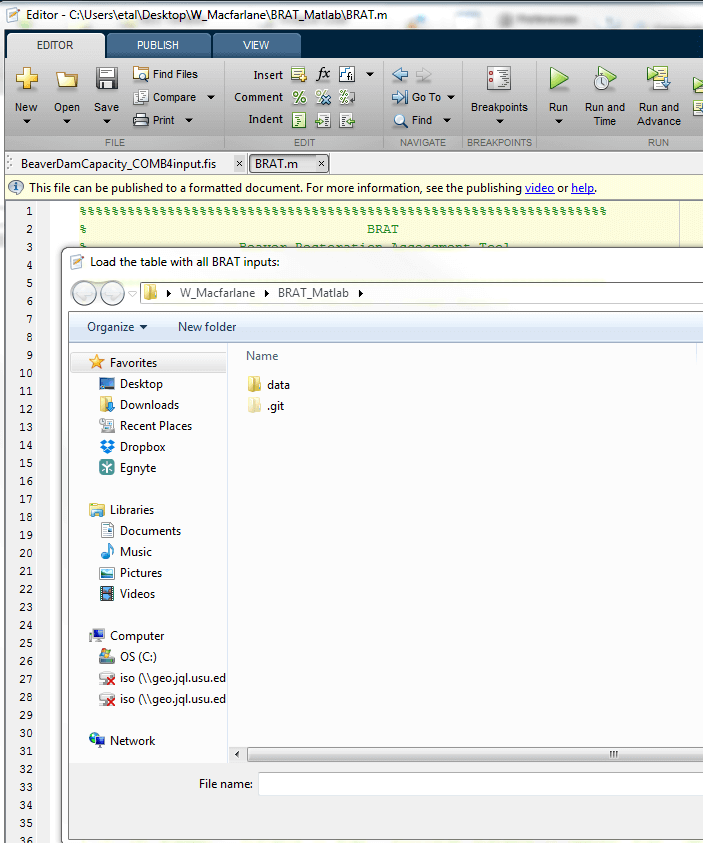
- Step 5: Browse to the directory that contains the Matlab input csv table (Final_NHD_from_GIS.csv).
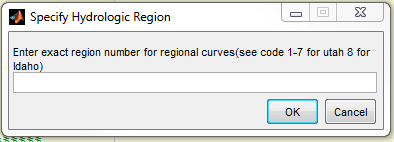
- Step 6: Open the correct input .CSV file and the “Specify Hydrologic Region” widow opens.
-
Step 7: Select the correct regional curve
-
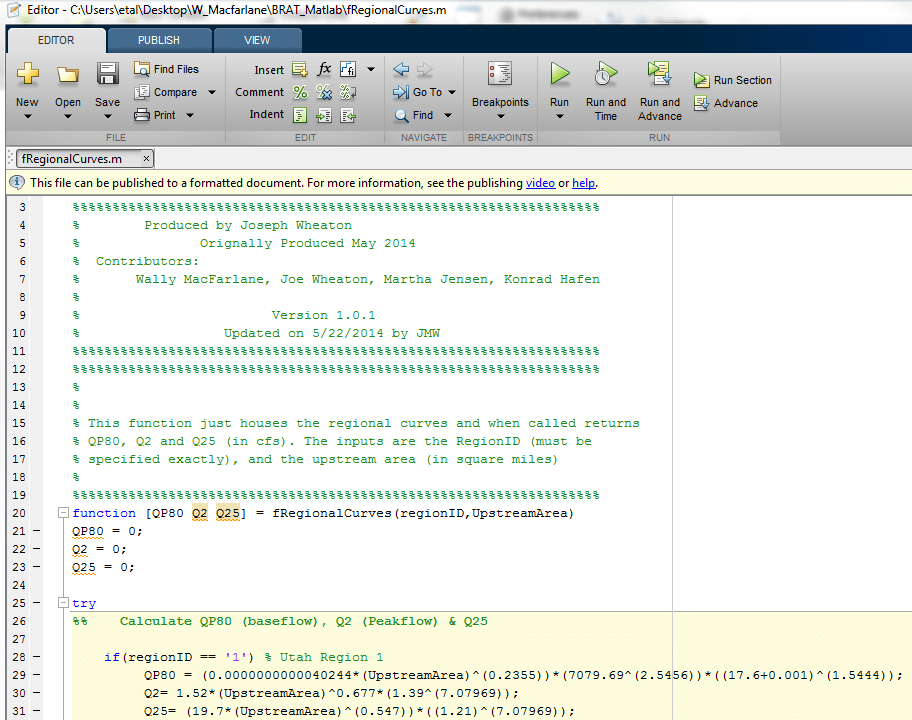
Step 8 (If working outside of Utah ): At the present time, the FIS is set-up to run stream power calculations for Utah and Southeast Idaho obtained from USGS StreamStats Regional Regression Equations. If you are working outside this area you’ll need to obtain and add the appropriate QP80, Q2, and Q25 stream power equations to the fRegionalCurves.m file. You can find regional curves for most parts of the US on the USGS’s National Streamflow Statistics Website.
Output:
- BRAT_Final_NHD_from_GIS.csv
Note: The FIS code adds the pre-fix BRAT to the output table name.
<- Back to Step 7 Ahead to Step 9 ->