Summary
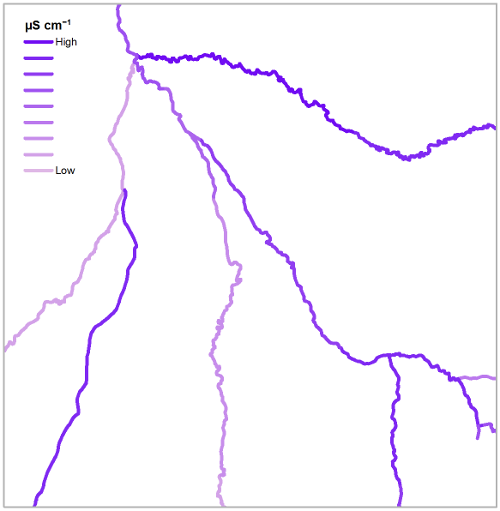
Electrical conductivity has been shown to be a potential indicator of aquatic macroinvertebrate species richness (Spieles and Mitsch 2000, Brown, Hannah et al. 2007) and can also influence faunal life stages (Tarín and Cano 2000). Preliminary gross primary productivity model development work by Eco Logical Research, Inc. (ELR) has shown promising results using temperature, solar inputs, and conductivity as inputs. By incorporating a previously developed electrical conductivity predictive regression model (Olson and Hawkins 2012), we built an automated workflow for predicting conductivity for a stream network, summarizing predicted upstream conductivity values (μS cm−1) per 1000 meter stream segments.
The random forest electrical conductivity model was developed using 19 environmental parameters (detailed in Olson and Hawkins, 2012). To determine predicted electrical conductivity for a stream network, a series of data pre-processing steps must be performed prior to initiating the actual modeling process. The user must first segment streams reaches into segments of uniform-length using the Segment Stream Network from the Geomorphic Network and Analysis Toolbox (GNAT), a custom ArcGIS Python toolbox developed by South Fork Research, Inc. The user should then delineate upstream catchment area polygons for reach stream segment using another custom Python toolbox, the Catchment Tool. These upstream catchment area polygons are used to calculate mean values from raster datasets representing each of the 19 environmental parameters. The summary values for each catchment area and it’s associated stream segment are compiled into a table, which serves as the primary input for the random forest model to generate predicted electrical conductivity values per stream segment.
Currently, Conductivity Tools includes two tools: Pre-process Environmental Parameters and Predict Conductivity, which should be run in sequence.
Environmental parameters used by the Random Forest model to predict conductivity:
- Atmospheric Ca
- Atmospheric Mg
- Atmospheric SO4
- Compressive strength
- Day last freeze
- Log hydraulic condition
- Max wet days
- Maximum temperature
- Mean maximum EVI
- Mean precipitation
- Mean summer precipitation
- Mean wet days
- Minimum precipitation
- Percent CaO
- Percent MgO
- Percent S
- Soil bulk density
- Soil erodibility
- Soil permeability
Citations
- Brown, L. E., et al. (2007). Vulnerability of alpine stream biodiversity to shrinking glaciers and snowpacks. Global Change Biology 13(5): 958-966.
- Liaw, A. and M. Wiener. 2002. Classification and regression by randomForest. R New 2(3): 18-22. Package URL: https://cran.r-project.org/web/packages/randomForest. Accessed 6/21/2016.
- Olson, J. R. and C. P. Hawkins (2012). Predicting natural base-flow stream water chemistry in the western United States. Water Resources Research 48(2): W02504.
- Spieles, D. J. and W. J. Mitsch (2000). “Macroinvertebrate community structure in high-and low-nutrient constructed wetlands.” Wetlands 20(4): 716-729.
- R Core Team (2016). R: A language and environment for statistical computing. R Foundation for Statistical Computing, Vienna, Austria. URL https://www.R-project.org/
- Tarín JJ, Cano A, editors. Fertilization in protozoa and metazoan animals: cellular and molecular aspects. Springer Science & Business Media; 2012 Dec 6.
Acknowledgments
The Conductivity Tools toolbox has been developed for South Fork Research, Inc. by Jesse Langdon.
License
Licensed under the GNU General Public License Version 3.