4. Watershed Hydrology
See Corresponding Learning Module
Module 4 Overview
There are two parts to this assignment. The first is characterizing hydrology of a rivercape, and the second is a semester-long Bingo assignment in which you observe hydrologic processes in the field.
Note that the due dates for part 1 and part 2 are different. See Canvas.
Part 1- Remote Hydrology assessment
For this part of the assignment, you will analyze hydrology of a chosen reach of riverscape using QRiS, the USGS StreamStats application, and Riverscapes Network Models. You get to choose any riverscape (along the NHD+ drainage network) in the conterminous US that you would like to analyze. You will produce a webpage on your website for this part of the assignment.
Instructions
Catchment Delineation and Characteristics
- Create a new QRiS project and zoom to the riverscape that you are going to analyze (in the U.S.).
- Use the Catchment Delineation tool in QRiS to delineate the drainage basin of your reach. In the QRiS panel, navigate to
Inputs -> Context -> Catchment Delineations. Right click and selectRun USGS StreamStats. Follow the directions to place a pour point for which a watershed will be delineated. The point placement must coincide spatially with the drainage network the API is using, so sometimes it takes multiple attempts, placing the point in slightly different locations to get it to work (or load the hydrography network layer from Riverscapes Context and place point on it). In the dialog box, name the point and check the box 'Calculate Basin Characteristics', the click 'OK'.
Basin characteristics aren't available/don't work everywhere. If they do work, the information will be stored as json text in the 'basin_characteristics' field of the point you created.
- If the basin characteristics were calculated, the video below demonstrates how to view those and quickly calculate some yourself to compare values. If they weren't calculated you can still manually calculate a few (e.g., average elevation, slope, mean annual precipitation) using datasets from a Riverscapes Context project (see video below).
Write a brief summary of some of your basin characteristics (whether they were calculated automatically or you have to assess them from datasets in the Riverscapes Context project).
Write another subsection or paragraph describing your interpretation of how the basin characteristics might contribute to the hydrology. What type of hydrology do you think your basin exhibits (e.g., flashy, steady, seasonal, snowmelt driven, rainfall driven, mixed, etc.) If catchment characteristic calculation worked, compare automatically calculated values to manually calculated values.
Explore Nearby Stream Gages
To understand the flow regime of your riverscape, we can start by looking at time series (hydrographs) and summary statistics from real stream gages. To do this, you will explore nearby stream gages using the Stream Gage Explorer in QRiS. We do this, because it is very unlikely that the reach you are analyzing has a stream gage on it. However, nearby gages can provide insight into the hydrology of your reach.
- In your same QRiS project tree from above, Navigate to
Inputs -> Context -> Stream Gagesin the QRiS panel. Right click on theStream Gagesnode and selectExplore Stream Gages. This will open a separate panel. In the panel clickDownload Gagesto find any nearby stream gages. Select one gage, and set the date range to the last 10 years, then click 'Download Discharge'. The x-axis date range will likely be an illegible mess, but you will be able to see annual/seasonal flow patterns for the gage. Describe the hydrograph and what it demonstrates (you can export a csv of the data and produce a better looking figure in Excel or Sheets to include on your page if you want). What is the highest recorded discharge? The lowest? What is the ratio between the two and what does that tell you about the hydrology?
Translating Stream Gage Data back to Your Reach
Hydrologists use regional curves to relate stream gage data to ungaged locations (like your reach). These typically relate drainage area (and other watershed characteristics like we calculated above) to a discharge statistic (e.g. a 2 or 100 year recurrence interval flow). The Riverscapes Consortium has a Hydrologic Context Model that estimates low flow and typical flood discharges across the conterminous US using regional curves. You will use this tool to talk about the flow regime of your reach.
- Look at predictions of low flow and typical flood magnitudes for your reach from the Hydrologic Context network model. Right click on your project node in the QRiS panel and click
[Browse Data Exchange Projects](https://qris.riverscapes.net/software-help/projects/#browse-data-exchange-projects). Find and Download a Hydrologic Context for the watershed your reach falls within from the Data Exchange. Unzip and open the project with the Riverscapes Viewer plugin and explore the outputs. Produce figures of low flow discharge, and typical flood discharge across the watershed. Look at the values for your reach specifically (attributes 'QLow' and 'Q2' in the attribute table). Do these values seems reasonable? What is your assessment of the reach you chose?
- Depending on the geography you chose, values may be very accurate or completely off. Some areas have received QA/QC for the regressions used and the parameter values, while others are generated values from simple drainage area-based regressions based on sparse gage data and may be very inaccurate.
- Optionally, if you want to include andy of the map data from your Hydrologic Context project in your QRiS project, you can do so by right clicking on the layers in the Hydrologic Context project tree within the Riverscapes Viewer panel and selecting
Import Layer into QRiS Project. One of the nice features is you can clip the data on import down to your area of interest (e.g. the catchment you delineated). Here is the command reference for that. The advantage of including these layers in your QRiS project is that you will have all your data in one place for future analysis or reference. It also makes it easier for sharing with others (step 6)
Transparently share your work
-
Close your QRiS Project using the QRiS menu. Then open it using Riverscape Viewer (NOT QRiS). In the Riverscapes Viewer panel, right click on your project node and select
[Upload Project to Data Exchange](https://viewer.riverscapes.net/tutorials/riverscapes-project-data-exchange/). This will allow you to upload it to the Riverscapes Data Exchange where you can share it with others. Copy the link to your project on the Data Exchange and include it on your web page for this assignment so that others can explore your work. -
On your web page for this assignment, include sections for each of the steps above with figures, maps, and discussion of your results and interpretations. You do not need to write a thesis, but make sure a reader can follow your work and understand your interpretations.
Part 2 - Hydrologic Processes Bingo
Get your field notebook page on your website setup and at least two processes observed. In setting it up, you need to commit to (and stick with the whole semester) one bingo card. The real assignment will run all semester long. You need to get "Bingo" by the end of the semester. The first three to declare Bingo (and not have their results contested) will get a prize and a Grand Prize will go to the first Full Card winner.
The Rules
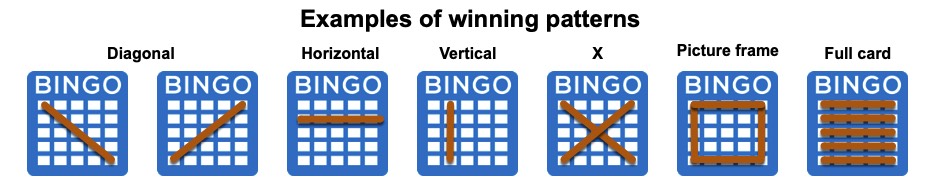
In normal Bingo you all get different bingo cards. Here, you have four bingo cards to choose from below. Your job is to get Bingo by one of the following winning patterns:
The way you record your processes will be as follows: Show on your web page, which bingo cell you are reporting. Keep a running list of all cells below as sub-heading sub-sections in which you:
- denote the process you are reporting
- provide a one sentence definition of process
- show us the process (preferably a video narrated) in action (or a very well annotated photo or series of photos) from your own local field observations.
- explain why you think it is that process
Your observations must be your own (no re-using of other's YouTube videos.. though you can use them for inspiration). You need to observe these processes in the field.
The Bingo Cards
All have the same mix of processes... just in different orders. Choose one and stick to it.
Card 1
| drizzle (precipitation) | sheet flow (interill) | pipeflow | infiltration | percolation |
| overbank flow | snow throughfall | infiltration excess overland flow | throughflow | snow accumulation |
| rain (precipitation) | base flow | FREE | snow (precipitation) | condensation |
| sublimation | interception | saturation excess overland flow | evaporation | bankfull flow |
| gully flow | stemflow | subsurface stormflow | rill flow | return flow |
Card 2
| sublimation | condensation | saturation excess overland flow | evaporation | interception |
| overbank flow | bankfull flow | infiltration excess overland flow | gully flow | snow throughfall |
| stemflow | snow accumulation | subsurface stormflow | rill flow | return flow |
| drizzle (precipitation) | sheet flow (interill) | pipeflow | infiltration | percolation |
| rain (precipitation) | throughflow | FREE | snow (precipitation) | base flow |
Card 3
| sublimation | interception | saturation excess overland flow | evaporation | bankfull flow |
| overbank flow | snow throughfall | infiltration excess overland flow | throughflow | snow accumulation |
| gully flow | stemflow | subsurface stormflow | rill flow | return flow |
| drizzle (precipitation) | sheet flow (interill) | pipeflow | infiltration | percolation |
| rain (precipitation) | base flow | FREE | snow (precipitation) | condensation |
Card 4
| drizzle (precipitation) | sheet flow (interill) | pipeflow | infiltration | percolation |
| overbank flow | bankfull flow | infiltration excess overland flow | gully flow | snow throughfall |
| stemflow | snow accumulation | subsurface stormflow | rill flow | return flow |
| rain (precipitation) | FREE | through flow | snow (precipitation) | base flow |
| sublimation | condensation | saturation excess overland flow | evaporation | interception |
Bingo Pages
2021 Class
Thanks to everyone for sharing their Bingo Pages:
- Triton Abeyta
- Jens Ammon
- Alec Arditti
- Gabe Benitez
- Haley Canham
- Amy Carmellini
- Jeffrey Chandler
- Casey Choate
- Daniel Cremin-Thurber
- Denny Haynes
- Lauren Herbine -
- Megh Raj
- Carter Lybeck -
- Kathryn Ann Margetts
- Manisha Panthi
- Anna Paulding
- Shelby Sawyer
The 2021 Winners 🏆 (first to declare Bingo) were: Gabe Benitez and Manisha Panthi
Student Example Observations

Infiltration Excess Overland Flow
Gabe took this photo on a bike trip through Pennsylvania

Overbank Flow
Manisha had a ton of great examples including this overbank flow example from the Naranyani River in Nepal in her module 4 Bingo assignment
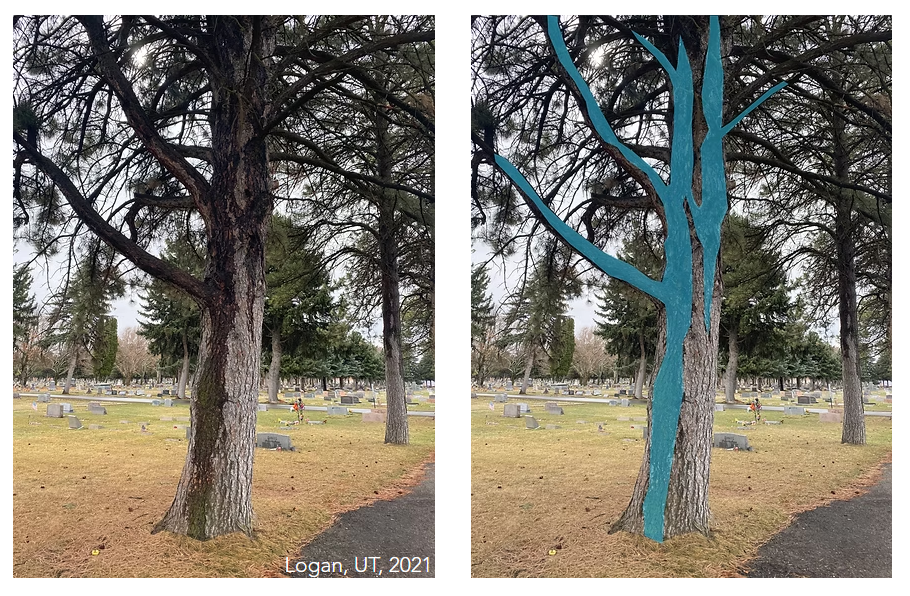
Stemflow
Jens captured this example of stemflow in the cemetery.
Worth a Look
Just cool examples:
- Casey's site is well worth a look.
- Haley got a double bingo and had a great sheet flow example. -
- Amy did a really exemplar job explaining the hydrologic processes in each of her videos as well as defining them in the videos. -
- Daniel and Jeff both have a ton of the bingo card populated with links to videos. Daniel's explanations and definitions are exceptionally clear and useful. I was particularly impressed by the coffee infiltration (I think Daniel could be one of those professional narrators or book on tape readers):
- Lauren has some really fun examples and nice stories to go along with each. -
- Denny's definitions were a really helpful way to present these. -
- Shelby's snow accumulation time-lapse is a PBR soft spot for me.
- Kat, like Daniel, had some wonderfully clear explanations and definitions. I was particularly impressed by her multi-tasking (I think she did this condensation and snow accumulation videos while walking to class)! Impressive.
- Anna provided a really clear list of definitions and log of her observed processes.